One filtered set, several ways to look at it
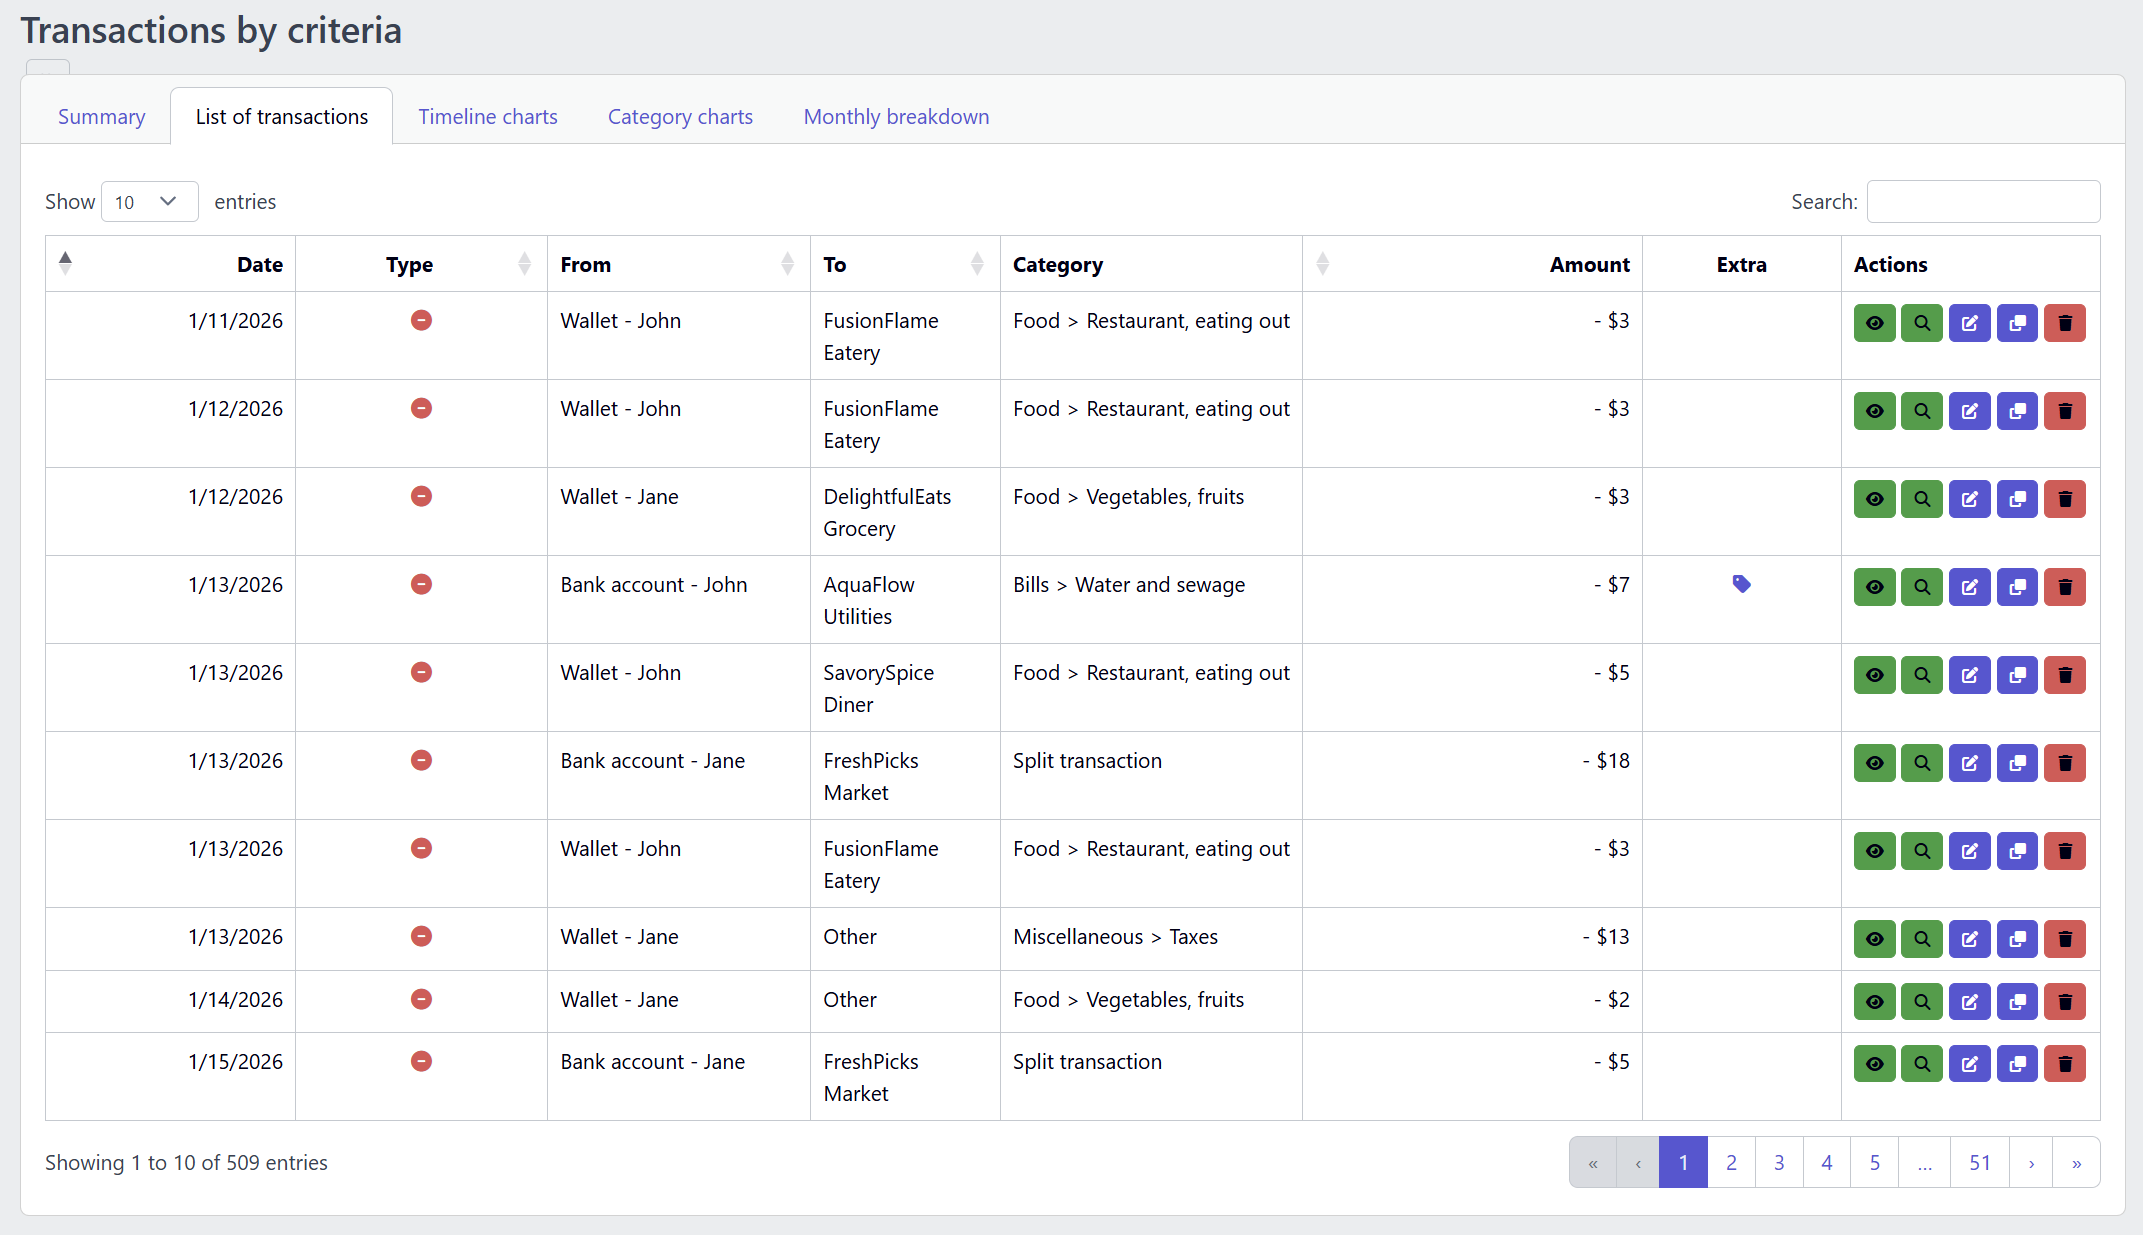
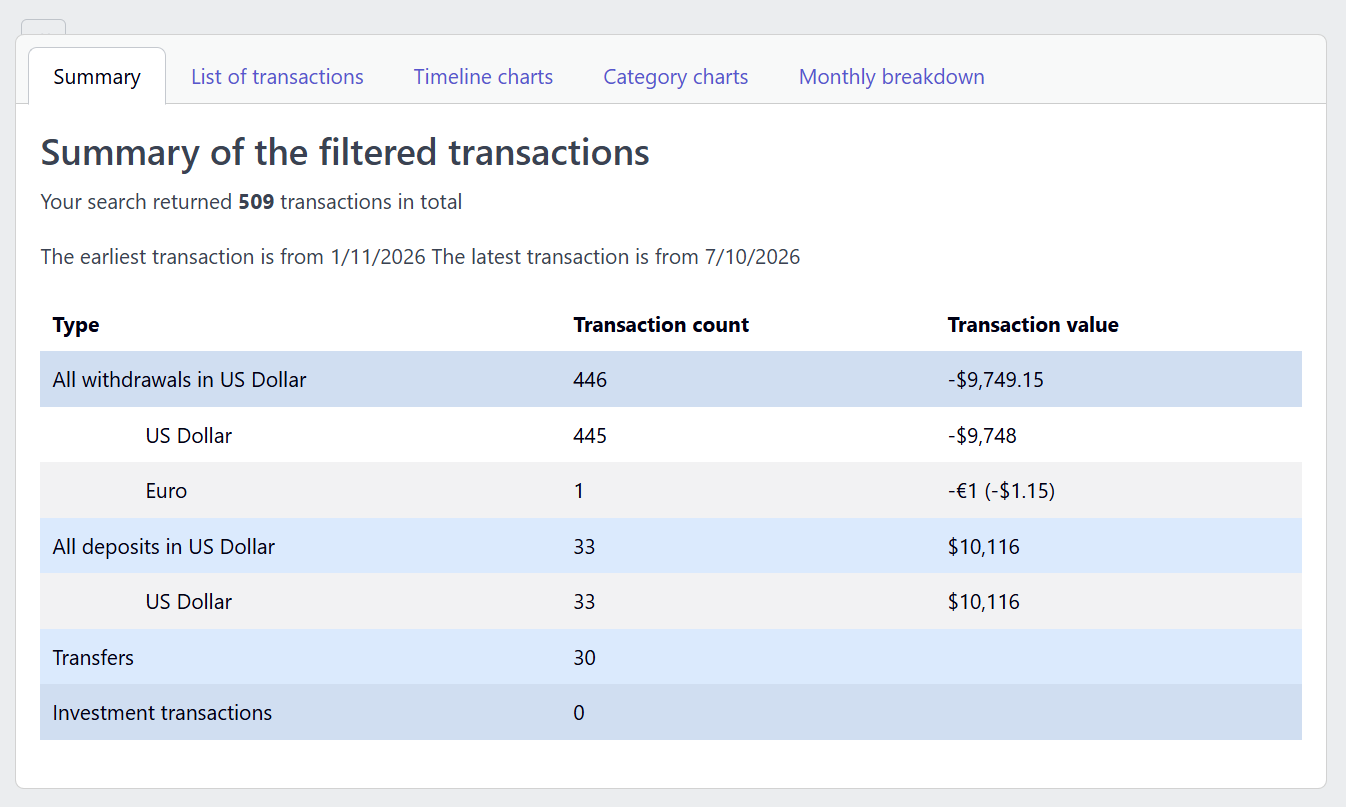
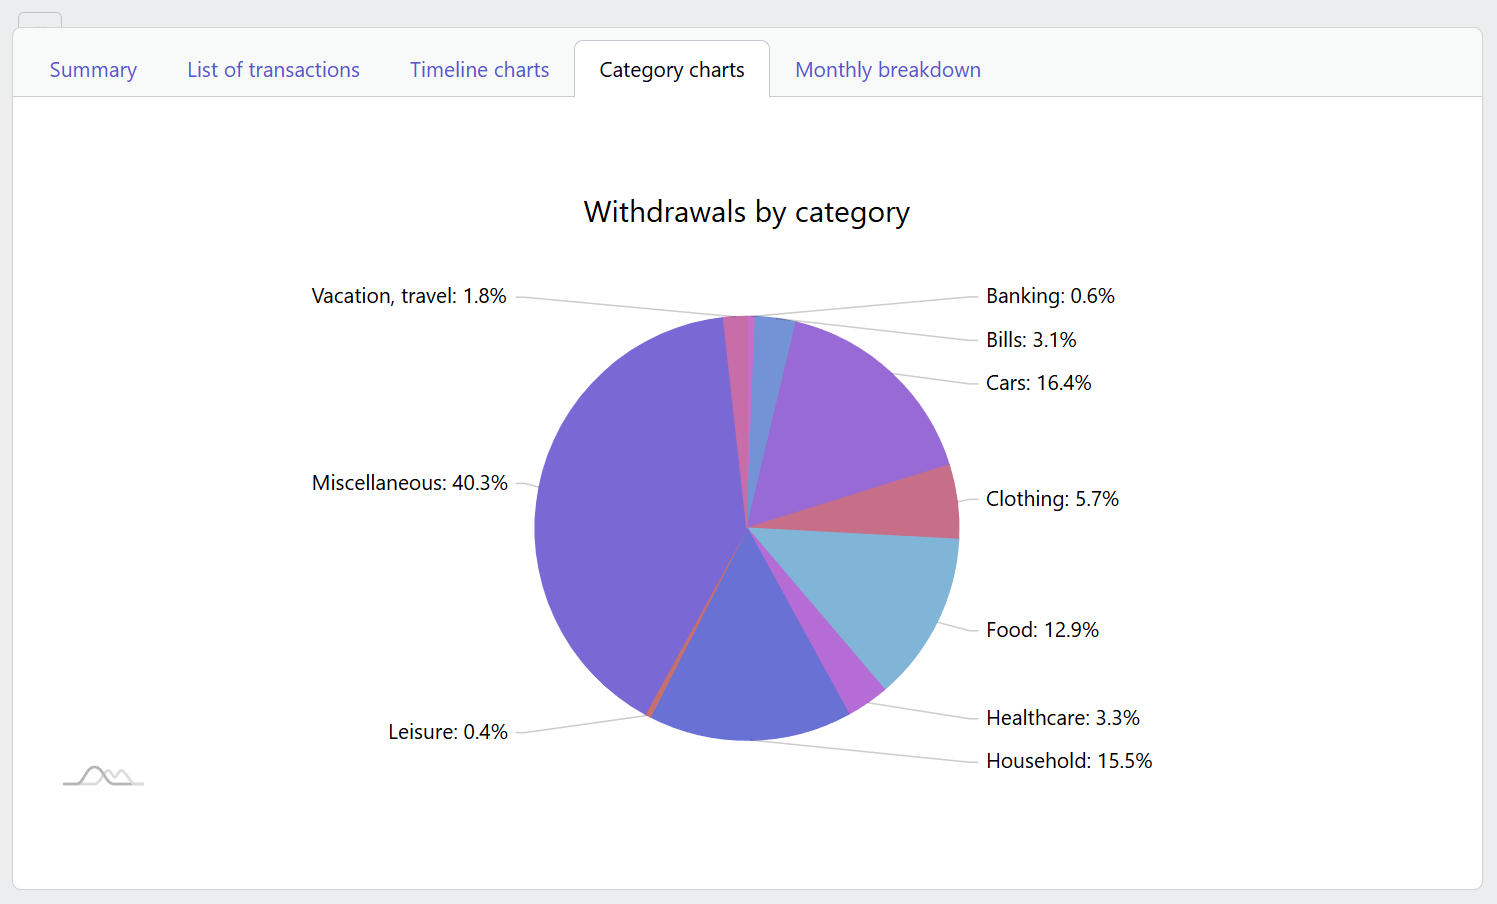
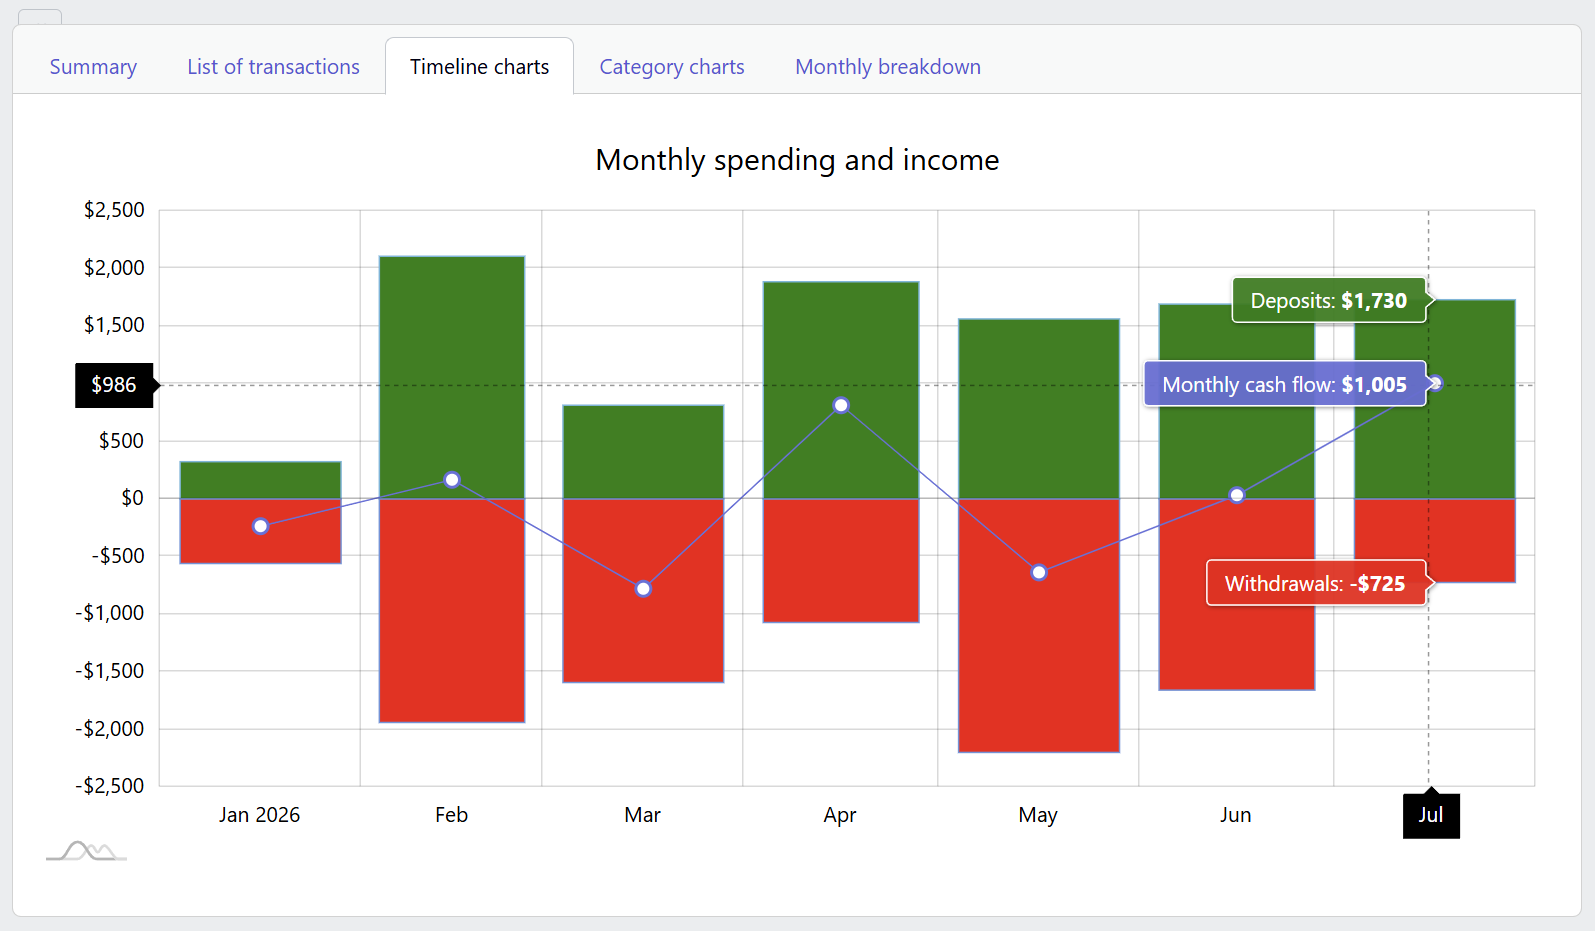
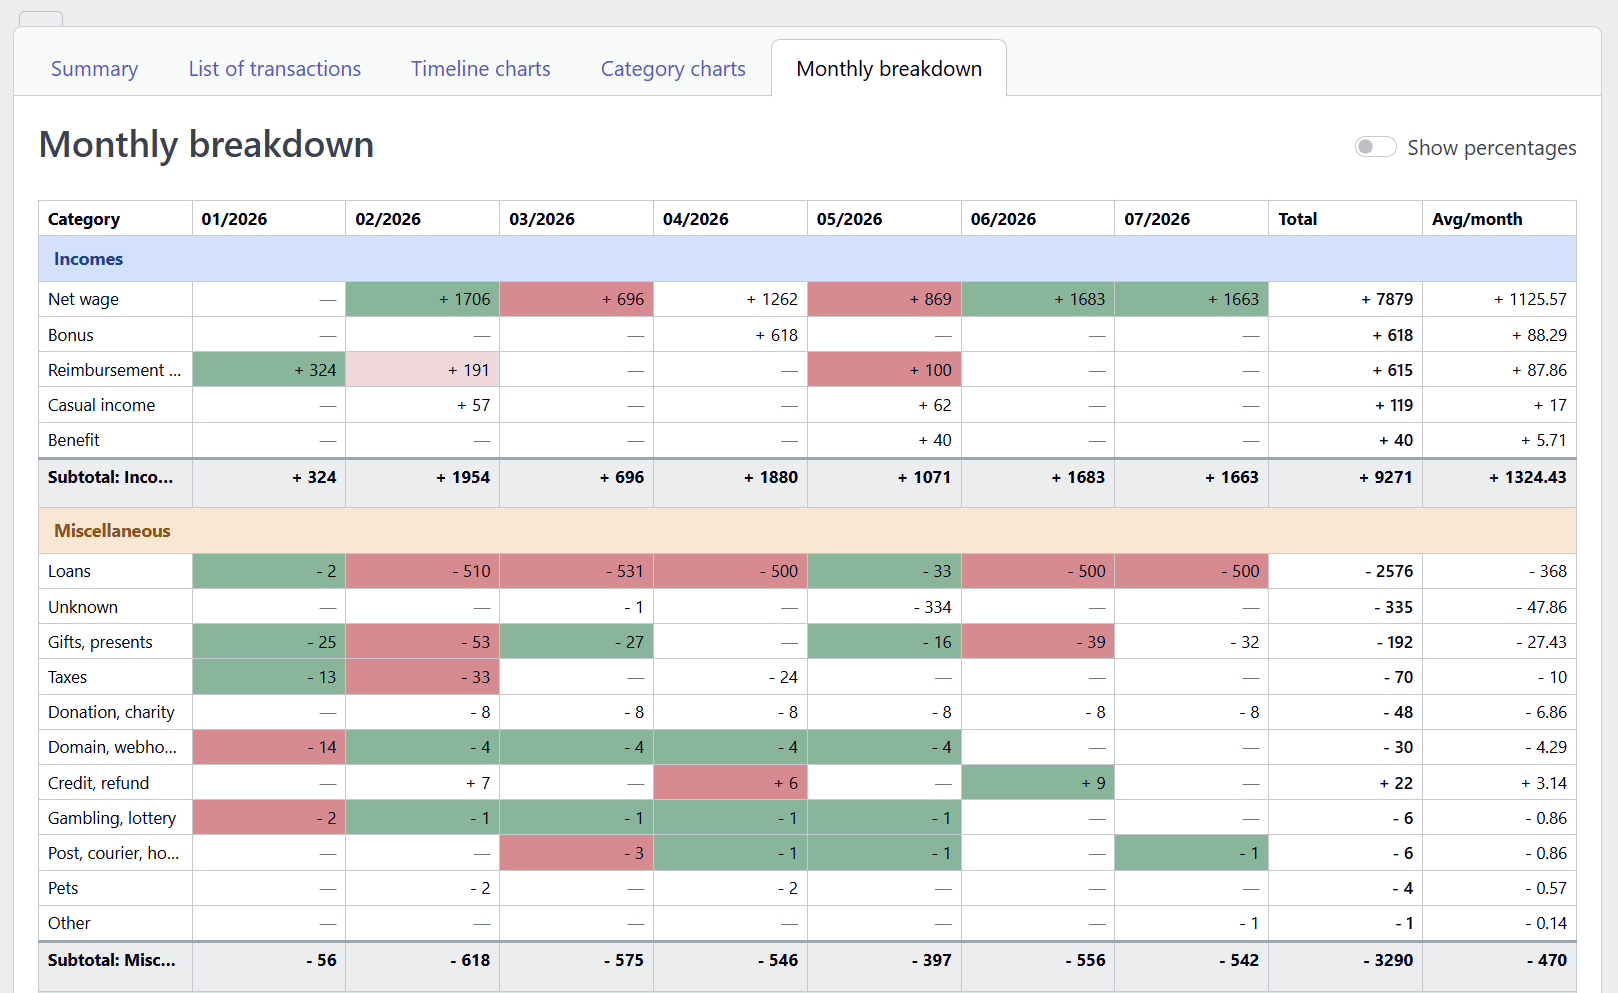
Once your filter returns a result, you move between tabs without changing the underlying query - useful for comparing a summary view against the raw list, or a chart against a table, while investigating the same question from different angles.
Count only what matches your filters
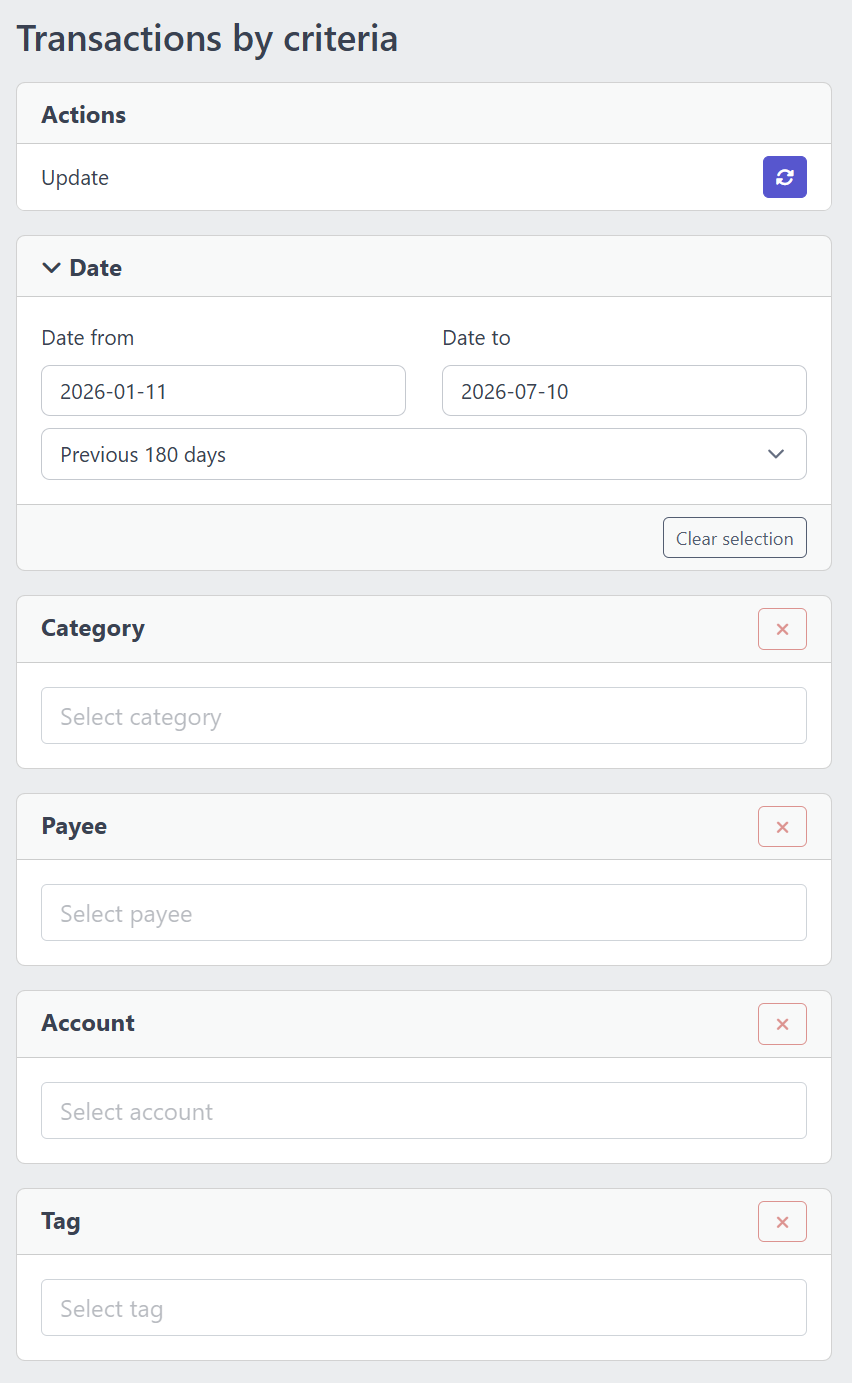
A single transaction can be split across several items, each with its own category and tags. When you filter by category or tag, YAFFA can either count every item of a matching transaction, or - with the “Only count matching items in breakdowns” switch on - only the items that match your filters. Turn it on when you want the category and monthly breakdowns to reflect just the spending you asked about.
If your filters cannot match anything at all, YAFFA warns you instead of quietly showing an empty report.
Drill down without losing context
From the monthly breakdown, clicking into a specific month narrows the current result set in place rather than starting an entirely new query - so you can go from a category spike in one month straight to the individual transactions that caused it, all within the same investigation. A left-hand sidebar hosts the filters and can be collapsed at any time to give the charts and tables more room.
This report is best for investigating what already happened. For a trend view of the overall direction of your finances, see the cash flow report .