
Cash Flow: see your monthly trajectory

Monthly balance change, running total, and investment value — with an optional look ahead

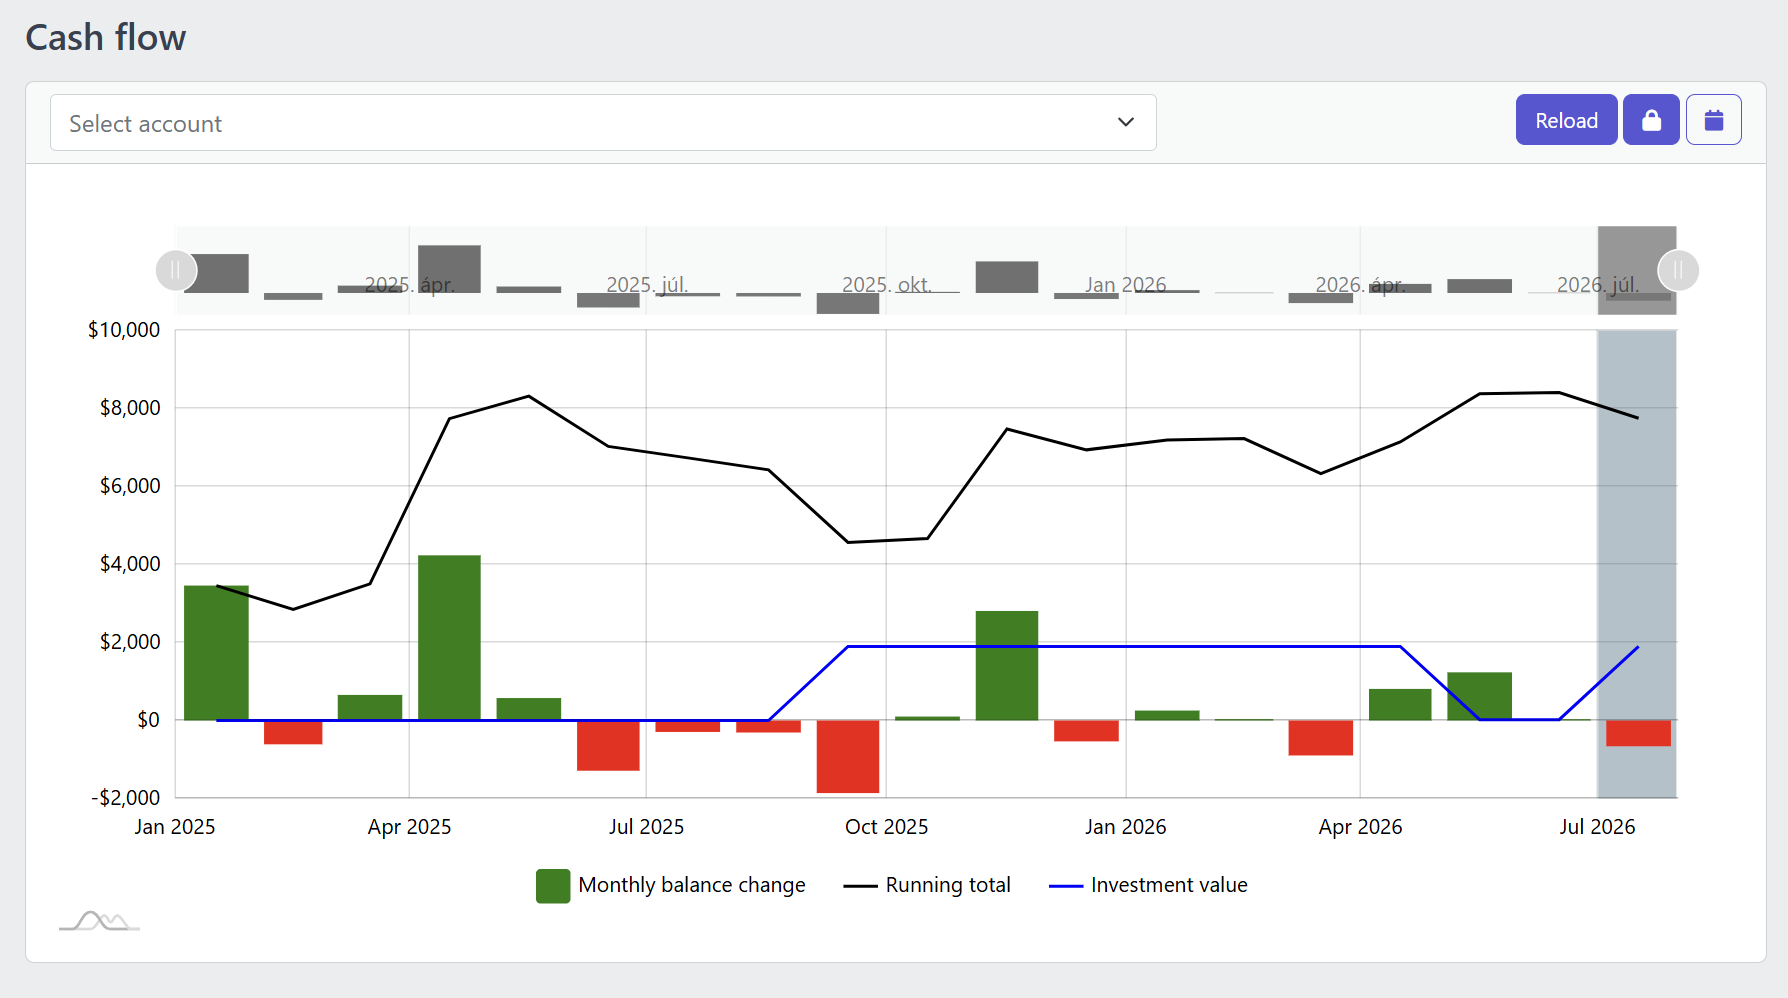
Screenshot of the YAFFA cash flow report showing monthly balance change bars, a running total line, and an investment value line for the past year and a half
Trend At A Glance

One chart, three signals

Individual transactions tell you what happened; the cash flow report tells you what it added up to. Green and red bars show the net balance change for each month. A black line tracks the cumulative running total, which is usually easier to read than isolated monthly swings. A blue line shows investment value alongside it, so you can see cash and investments move together on the same timeline. You can scope the whole chart to a single account or keep the broader, all-account view — and every value is converted to your base currency so multi-currency accounts do not distort the picture.

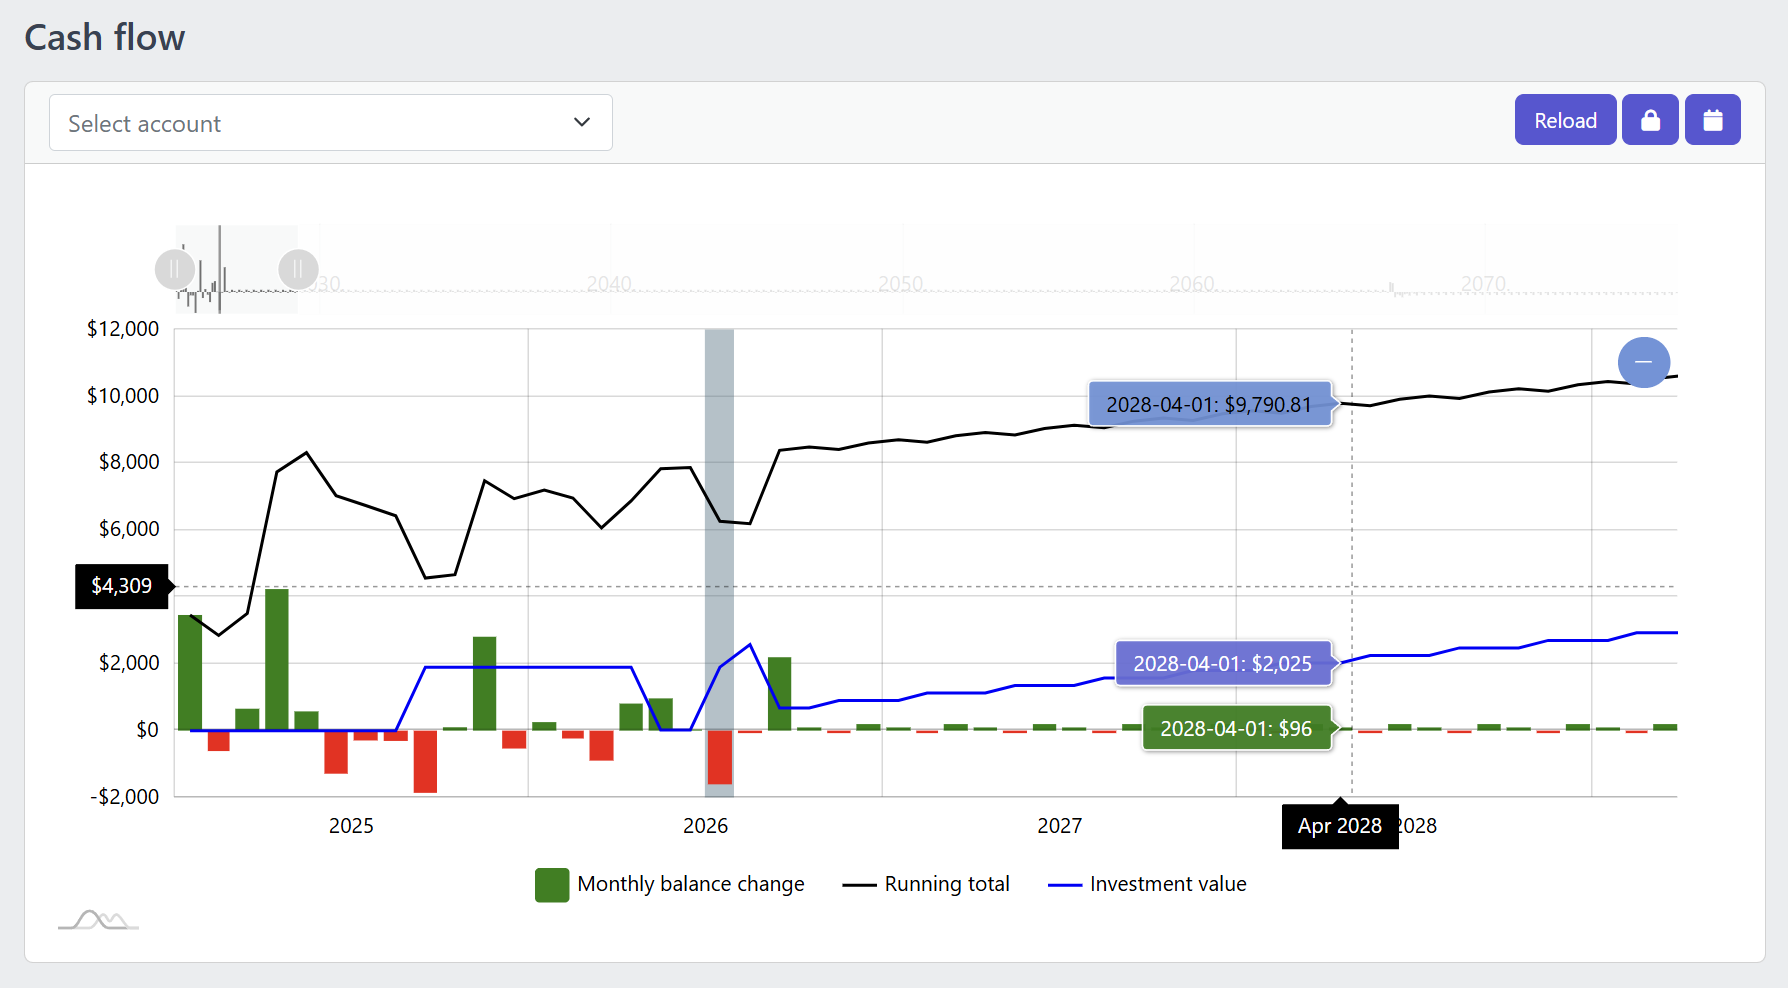
Screenshot of the YAFFA cash flow report with the forecast toggle enabled, showing the running total projected several years into the future
Forecast-Aware

Turn on the forecast toggle to see where you are headed

Enable the forecast option and the same chart extends forward, driven by your schedules and budgets rather than opaque automation. Zoom or pan across the timeline to check whether your planned commitments still fit your available funds, or whether accumulated free cash is building up fast enough to be worth saving or investing.

When to reach for this report

  • You want to know whether you are consistently building a monthly surplus, or only occasionally.
  • You want to check whether planned commitments fit your currently available funds.
  • You want to see whether accumulated free cash has grown large enough to move into savings or investments.
  • You want to sanity-check whether one particular account is becoming stressed or underused.

Reading the chart

The report reads from precomputed monthly account summaries rather than recalculating every transaction on each request, so it stays responsive even with years of history. Values are grouped by month and transaction type, and non-base-currency amounts are converted using the latest available monthly rate — practical for interpretation, though not intended as formal accounting precision. The current month is highlighted so you always know where "now" sits on the timeline.


Best for trend, not for detail

Cash flow is built to answer trend questions — is the direction healthy? Is it improving or slipping? When a specific month looks unusual and you want to know exactly which transactions caused it, switch to Find Transactions and filter down to that period.


Under the hood

The forecast is based on scheduled transactions and budgets . YAFFA is not making assumptions and projections based on your past behavior, but rather helps you plan and forecast. For this the best tool is the budget chart report, which can be used to see trends in your spending and set up budgets and forecasts accordingly. The cash flow report then takes those budgets and schedules into account to show you where your finances are headed.

Explore YAFFA

More features and further details

Check out other features of YAFFA personal finance application, or learn more by reading the detailed documentation.

Features

Learn more about the features of YAFFA personal finance application

Learn More about Features

Documentation

Read detailed guides how to get started with YAFFA personal finance application.

Learn More about Documentation

Budget Chart

Compare actual spending against your plan, category by category, with a moving-average trend line

Learn More about Budget Chart

Ready to take control of your finances?

Try the YAFFA sandbox free — no credit card, no bank connection, no data sharing.

Try the Demo — No Install Needed